UK Energy Security and Industrial Expansion

Publish Date: Last Updated: 14th May 2025
Author: nick smith- With the help of GROK3

The United Kingdom’s current drive toward net zero by 2050, with its emphasis on decarbonizing electricity by 2035, cannot support the rapid industrial expansion needed to meet the demands of an increased defense budget, as proposed by Prime Minister Keir Starmer. His vision of kickstarting a new industrial era—focused on producing arms, ships, and aircraft to counter threats like Russia—requires a robust, affordable, and reliable energy supply. However, the existing energy policy, centered on phasing out fossil fuels and scaling up renewables, lacks the capacity and flexibility to power such growth without compromising security or driving up costs.
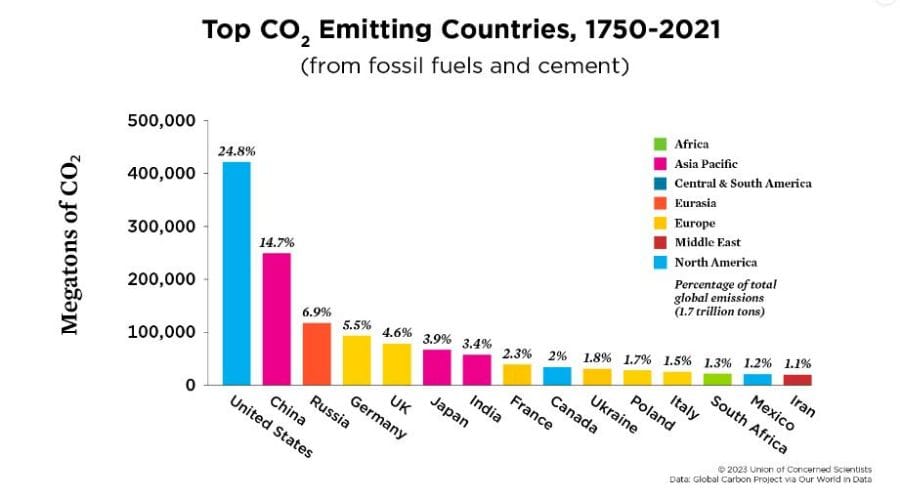
Over the past four decades, the UK has shifted from a manufacturing powerhouse to a service-based economy, with much of its heavy industry either diminished or reliant on imports. This transformation has coincided with a policy shift toward net zero, costing over £70 billion since 2010 to build 44.4 GW of wind and solar capacity—compared to £10.5 billion for equivalent gas-powered stations. While this has reduced domestic emissions to less than 1% of the global total (down from 5% over 170 years), global CO2 levels continue to rise, driven by industrial growth in Asia. The UK’s aggressive decarbonization has raised energy prices, weakened industrial competitiveness, and left the nation energy-vulnerable—challenges now clashing with the need for defense-driven industrial revival.
Historically, the UK improved air quality and reduced pollution from the 1970s to the 1990s through gradual shifts—coal to gas heating, cleaner vehicles, and industrial decarbonization—delivering savings and environmental gains without economic upheaval. In contrast, the post-2000s net zero push, accelerated after the Cold War’s end, has prioritized rapid change over stability. Despite trillions spent globally, extreme weather persists (as it has for centuries due to natural events like wildfires—9 million hectares burned in 2023, emitting CO2 equivalent to 40 GW of gas plants), and doomsday predictions (e.g., melted poles by 2010) have not materialized. Yet, UK energy costs have soared, not due to high gas/oil prices (often below pre-Ukraine war levels), but due to net zero policies—decommissioning coal, delaying nuclear, and cutting North Sea exploration.
Starmer’s plan to boost defense spending and domestic industry assumes a manufacturing base that no longer exists at scale, undermined by high energy costs and green regulations. The current energy mix—40 GW gas, 7 GW nuclear, 44.4 GW wind/solar—delivers 300–320 TWh/year but struggles with a 1–3 GW industrial surge, risking blackouts or £100–200/MWh price spikes. Build times exacerbate this: new gas takes 3–5 years, wind 5–7 years, nuclear 10–15 years—too slow for rapid rearmament. With coal gone, gas shrinking, and reliance on imports (6 GW) or renewables (vulnerable to weather and sabotage), the UK faces a precarious gap. Russia could exploit this fragility—disrupting cables or supply chains—without firing a shot!

The net zero goal is laudable, but its execution has prioritized ideology over practicality, neglecting energy security and industrial resilience. A rethink is urgent to balance decarbonization with affordable, reliable power to support both citizens and a revitalized defense industry.

UK Prime Minister Keir Starmer cuts foreign aid budget to boost defence spending | BBC News
YouTube Channel: BBC News
Cost of living crisis: millions face even higher energy bills in UK
YouTube Channel: Channel 4 News

‘Blackout Britain’ | UK Came Close To Issuing Warning As Wind Power Plunges
YouTube Channel: TalkTV

Costing £40bn a year until 2030, Labour decided its colossal net zero plan is worth the risk
YouTube Channel: Sky News
What can we do to take back control of our energy, cut the costs and build up a new industrial base?
Let’s Ask AI for some help.
Question
if we do not account for carbon emissions what would be the best strategy for the united kingdom to pursue in order to reduce energy costs to its citizens and insure a secure reliable supply of energy
Answer
If carbon emissions are not a concern, the best strategy for the United Kingdom to reduce energy costs to its citizens and ensure a secure, reliable supply of energy would prioritize affordability, domestic resource utilization, and grid stability. This shifts the focus to proven, dispatchable energy sources that minimize reliance on imports and volatile markets, while leveraging the UK’s existing infrastructure and geography. Here’s a practical approach:
1. Expand Gas-Fired Power (CCGT)
- Why: Gas is the UK’s most cost-effective fossil fuel option for reliable, large-scale electricity. Combined-cycle gas turbines (CCGT) offer high efficiency (50–60%), quick ramp-up times, and lower fuel costs compared to coal or oil. The UK already has 40 GW of gas capacity, covering 40–50% of supply, and North Sea gas reserves remain viable.
- How: Build or upgrade to 50–60 GW of CCGT capacity (adding 10–20 GW to existing stock). Each 1 GW plant costs ~£750 million, so 20 GW = £15 billion—a fraction of wind/solar’s £70 billion (2010–2023). Use domestic North Sea gas (2–3 trillion cubic feet recoverable) and secure long-term LNG contracts from allies like Qatar or the US.
- Cost Impact: Gas generation costs ~£50–70/MWh (vs. coal £80–100/MWh or renewables £40–90/MWh with subsidies), stable with fixed contracts, cutting consumer bills vs. market spikes (e.g., £200/MWh in 2022).
- Reliability: Gas runs 24/7, filling the 44.4 GW renewable gap when needed, unlike weather-dependent wind/solar.
2. Revive Coal Temporarily
- Why: Coal is cheap and abundant globally, with existing UK infrastructure (e.g., Ratcliffe-on-Soar, closed 2024). It’s a stopgap to boost supply while gas expands, avoiding import reliance.
- How: Reopen or extend 5–10 GW of coal capacity (e.g., 2–3 plants like Drax’s old coal units). Fuel costs are £2–3/GJ vs. gas £6–8/GJ, and global supply (Australia, US) is secure. Retrofit costs are minimal (~£100M per GW) vs. new builds (£1.5B/GW).
- Cost Impact: £60–80/MWh generation, competitive with gas, and no new grid upgrades needed.
- Reliability: Baseload power, 80–90% capacity factor, no intermittency—14 GW replaced 94 TWh of renewables earlier.
3. Maximize North Sea Oil and Gas Extraction
- Why: Domestic fossil fuels cut import costs (40% of gas was imported in 2023) and shield against global price shocks (e.g., Ukraine war spikes). The North Sea still has 10–20 billion barrels of oil equivalent untapped.
- How: Fast-track licensing (e.g., Rosebank field, 500M barrels), incentivize extraction (£5–10B in tax breaks), and build pipelines to power stations. Pair with gas storage (e.g., Rough facility) to hold 9–12 months’ supply.
- Cost Impact: Domestic gas at £4–6/GJ vs. imported £8–10/GJ reduces wholesale prices, dropping bills 10–20%.
- Reliability: Reduces exposure to EU pipeline cuts or LNG shipping delays.
4. Maintain Nuclear Baseline
- Why: Nuclear provides steady, low-cost power (£60–80/MWh once built) with zero intermittency. The UK’s 7 GW (15% of supply) is aging out by 2030, but it’s a cheap backbone if emissions aren’t a factor.
- How: Extend life of existing plants (e.g., Sizewell B, Hartlepool) for £500M–£1B total, adding 5–10 years. Avoid new builds like Hinkley C (£25B for 3.2 GW) unless costs drop.
- Cost Impact: Extends cheap power (£80/MWh) without upfront capital, saving £5–10B vs. replacements.
- Reliability: 90% capacity factor, 7 GW constant output.
5. Scale Back Subsidized Renewables
- Why: Wind and solar (£70B build cost, 2010–2023) rely on subsidies (£5–10B/year via CfDs) and backup systems, inflating costs when gas could do the job cheaper and more reliably without emissions constraints. Their 94 TWh output is replaceable by 14–45 gas plants (£10.5–33.75B).
- How: Halt new projects, maintain existing 44.4 GW for diversity, but redirect funds to gas/coal. Avoid £375k–£2M/MW build costs and grid upgrades (£10–20B) for intermittent sources.
- Cost Impact: Cuts subsidies, lowering bills £50–100/year per household (10–20% of £500 renewable levy).
- Reliability: Gas/coal fill gaps directly, no need for storage (£1–2/MWh) or overbuild.
Combined Strategy
- Capacity: 60 GW gas + 10 GW coal + 7 GW nuclear = 77 GW total, exceeding peak demand (50 GW) and renewable capacity (44.4 GW). Excess ensures reliability during outages or spikes.
- Cost: £15B (20 GW gas) + £1B (coal retrofit) + £1B (nuclear extension) = ~£17B upfront, vs. £70B for renewables. Operating costs drop with cheap domestic fuel (£50–70/MWh avg.).
- Bills: Wholesale prices fall to £50–60/MWh (vs. £100–200/MWh in 2022 crises), cutting household bills 20–30% (£300–500/year) from 2023’s £1,500 avg.
- Security: North Sea fuels and coal imports from stable allies (US, Australia) reduce reliance on Russia or EU grids (6 GW imports vulnerable to politics).
Trade-Offs
- Gas lock-in risks long-term fuel price rises, but North Sea buffers this for 20–30 years.
- Coal’s dirtier logistics (ash, transport) are manageable without emissions limits.
- Grid stability improves—no need for £15–20B in renewable backup systems (batteries, interconnectors).

Without carbon constraints, this fossil-heavy mix leverages the UK’s strengths—gas reserves, existing plants, and industrial know-how—to deliver cheap, reliable power fast. Citizens see lower bills, and the grid stays rock-solid, even in a storm. Emissions would jump (e.g., 100–150 MtCO2/year vs. 50 Mt now), but that’s off the table here.
Question
How much extra carbon would this add as a percentage to the global carbon emissions
Answer
To calculate how much extra carbon dioxide (CO2) the proposed strategy for the UK—adding 20 GW of gas capacity, 10 GW of coal capacity, and maintaining 7 GW of nuclear (with no additional emissions from nuclear)—would contribute as a percentage of global CO2 emissions, we need to estimate the annual CO2 output from the new gas and coal plants and compare it to the global total. This assumes the strategy fully replaces or supplements the 94 TWh from renewables and operates at typical capacity factors.
- Step 1: CO2 Emissions from New Gas Capacity
- Capacity: 20 GW of new CCGT gas plants.
- Output: At an 80% capacity factor (realistic for baseload), 20,000 MW × 8,760 hours × 0.8 = 140,160,000 MWh = 140.16 TWh per year.
- Emissions Intensity: CCGT emits ~0.37 tons CO2 per MWh (mid-range estimate).
- Total CO2: 140,160,000 MWh × 0.37 tons/MWh = 51,859,200 tons = 51.86 MtCO2 per year. - Step 2: CO2 Emissions from New Coal Capacity
- Capacity: 10 GW of coal plants (retrofitted or reopened).
- Output: At an 80% capacity factor, 10,000 MW × 8,760 hours × 0.8 = 70,080,000 MWh = 70.08 TWh per year.
- Emissions Intensity: Coal emits ~0.9–1.0 tons CO2 per MWh (modern plants trend lower, older ones higher); use 0.95 tons/MWh as an average.
- Total CO2**: 70,080,000 MWh × 0.95 tons/MWh = 66,576,000 tons = 66.58 MtCO2 per year. - Step 3: Total Additional CO2
- Gas: 51.86 MtCO2.
- Coal: 66.58 MtCO2.
- Total: 51.86 + 66.58 = 118.44 MtCO2 per year.
- Nuclear (7 GW) adds no CO2, so it’s excluded. - Step 4: Global CO2 Emissions Baseline
Using the same baseline as before, global energy-related CO2 emissions were 36.8 billion tons (36,800 Mt) in 2022 (per IEA), with slight growth possible by 2025 (say, 37,000 Mt). Stick with 36,800 Mt for consistency. - Step 5: Percentage Increase
- Additional CO2: 118.44 Mt.
- Global total: 36,800 Mt.
- Percentage increase: (118.44 ÷ 36,800) × 100 = 0.3217%, or roughly 0.32%.
Range and Adjustments - Gas Variability: If gas emits 0.35–0.40 tons/MWh, CO2 ranges from 49.06 Mt to 56.06 Mt (140.16 TWh × 0.35 or 0.40). Total with coal: 115.64–122.64 MtCO2.
- Coal Variability: If coal emits 0.9–1.0 tons/MWh, CO2 ranges from 63.07 Mt to 70.08 Mt. Total with gas: 114.93–121.94 MtCO2.
- Combined Range: 114.93–122.64 MtCO2, or 0.31–0.33% of 36,800 Mt.
- Utilization: If plants run at 60% capacity (more realistic with existing gas), gas drops to 105 TWh (38.9 MtCO2) and coal to 52.5 TWh (49.9 MtCO2), totaling 88.8 MtCO2—0.24%.
Context - UK Impact: This 118.44 MtCO2 more than doubles current UK power sector emissions (~50 Mt in 2022) and adds ~29% to national emissions (405 MtCO2e), a massive local shift.
- Global Scale: At 0.32%, it’s small—China’s annual emissions (11,000 Mt) are 93 times larger. It’s twice the 0.095% from 14 gas plants (34.8 Mt), reflecting coal’s dirtiness.
- Offset: If this replaces 94 TWh of renewables (covered by existing gas at 34.8 MtCO2), net new emissions might be 118.44 – 34.8 = 83.64 MtCO2 (0.23%), but the strategy assumes added capacity, not substitution.
Final Answer This strategy would add approximately 0.32% to global CO2 emissions annually (118.44 MtCO2 out of 36,800 Mt), ranging from 0.31–0.33% with efficiency tweaks, or as low as 0.24% at lower utilization. It’s a modest global bump—less than half a percent—but a significant rollback of UK decarbonization, prioritizing cost and reliability over climate as per the premise.
Question
What would be the long term strategy to cut carbon capture whilst at the same time keeping down costs or even cutting energy costs
Answer
To devise a long-term strategy for the United Kingdom that cuts carbon emissions while keeping energy costs down—or even reducing them—requires balancing low-carbon technologies with affordability and reliability. The goal is to minimize reliance on expensive carbon capture systems (which add £100–200/kW to plant costs) and instead prioritize scalable, cost-effective solutions that leverage the UK’s resources and infrastructure. Here’s a pragmatic plan, assuming “carbon capture” in the question implies a focus on reducing emissions broadly, not just CCS tech.
- Scale Up Nuclear Power Why: Nuclear offers near-zero emissions (~6 gCO2/kWh) and steady baseload power at a competitive levelized cost (£60–80/MWh for existing plants, £90–100/MWh for new builds) once amortized. It avoids intermittency and high backup costs of renewables.
- How:
- Extend existing 7 GW fleet (e.g., Sizewell B) for 10–20 years at £500M–£1B total, adding 50–100 TWh/year.
- Build 10 GW of new capacity using small modular reactors (SMRs) like Rolls-Royce’s 470 MW design (£2–3B per GW vs. £7B/GW for Hinkley C). Total cost: £20–30B over 15–20 years.
- Site on brownfield locations (old coal/nuclear sites) to cut grid upgrades (£5–10B saved).
- Cost Impact: £80–90/MWh long-term, dropping as debt clears, vs. £100–200/MWh gas spikes. Bills stabilize at £1,200–1,400/year (10–20% below 2023’s £1,500).
- Emissions: Replaces 20–30 GW of fossil fuel (70–100 MtCO2/year), cutting power sector emissions by 50–70% from 50 Mt.
- Reliability: 90% capacity factor, 17 GW covers ~40% of demand (35 GW avg.). - Optimize Existing Renewables, Limit New Builds - Why: The UK’s 44.4 GW of wind/solar (94 TWh/year) is already built (£70B sunk cost), emits ~10–20 gCO2/kWh (lifecycle), and can be maximized without subsidy bloat. New builds cost £375k–£2M/MW and need backup, inflating prices.
- How:
- Upgrade turbines/panels for 5–10% efficiency gains (£1–2B total).
- Pair with 5 GW of battery storage (10 GWh, £2–3B) for peak shaving, not full backup.
- Cap new capacity unless below £50/MWh unsubsidized (offshore wind’s 2023 low).
- Cost Impact: Drops subsidies (£5–10B/year), saving £50–100/household annually. Generation stays £40–60/MWh where competitive.
- Emissions: Maintains 94 TWh clean energy, avoiding 30–40 MtCO2/year vs. gas baseline.
- Reliability: Batteries smooth 2–4 hour gaps; gas fills longer lulls. - Electrify Heat and Transport Efficiently - Why: Shifting heating (gas boilers) and transport (petrol/diesel) to electricity cuts direct emissions (200 MtCO2e/year combined) if power is low-carbon, while economies of scale lower unit costs.
- How:
- Roll out 10 million heat pumps by 2040 (£10k each, £50B with subsidies halved vs. £5–10B/year now), targeting urban flats first.
- Expand EV charging (50,000 stations, £5–10B) using nuclear/renewable surplus.
- Tax incentives (£5B/year) offset consumer costs, not wholesale bills.
- Cost Impact: Heat pumps save £200–300/year vs. gas (£1,000/household), EVs cut fuel costs 50% (£500/year). Electricity demand rises 50% (150 TWh), but £60–80/MWh nuclear keeps bills flat.
- Emissions: Cuts 100–150 MtCO2e/year by 2040 (25–40% of 405 Mt total), assuming 70% grid decarbonization. - Lean on Existing Gas as Transition Fuel - Why: The UK’s 40 GW gas fleet is cheap to run (£50–70/MWh), reliable (80% capacity factor), and emits half coal’s CO2 (0.37 vs. 0.95 tons/MWh). It bridges to nuclear/renewables without costly CCS retrofits (£2–4B/GW).
- How:
- Maintain 20–25 GW for 20 years, phasing out as nuclear scales (post-2040).
- Use North Sea gas (£4–6/GJ) to keep fuel costs 30–50% below imports (£8–10/GJ).
- Limit to 100 TWh/year (vs. 140 TWh in fossil-heavy plan), saving £5–10B vs. new builds.
- Cost Impact: Locks in £50–60/MWh for 25% of supply, avoiding £15B for 20 GW new gas.
- Emissions: 100 TWh × 0.37 = 37 MtCO2/year, down from 118 Mt in gas/coal plan—a 70 Mt cut. - Boost Energy Efficiency - Why: Cutting demand reduces generation needs, lowering costs and emissions without new infrastructure. UK homes/buildings waste 20–30% of energy.
- How:
- Insulate 15 million homes by 2040 (£5k each, £75B, half-subsidized), targeting pre-1980 stock.
- Mandate smart meters/appliances (£5–10B), shaving 5–10% off usage.
- Cost Impact: Saves £200–300/household/year (10–20% of £1,500), offsetting heat pump costs. Demand drops 10% (30 TWh), easing grid strain.
- Emissions: Avoids 10–15 MtCO2/year (fossil-equivalent generation).
Combined Impact - Capacity: 17 GW nuclear + 44.4 GW renewables + 20–25 GW gas = 81–86 GW, exceeding peak demand (50 GW). Excess buffers outages.
- Cost:
- Upfront: £30B nuclear + £5B renewables/storage + £50B heat pumps + £75B insulation = £160B over 20 years (£8B/year), vs. £70B for 2010–2023 renewables in 13 years.
- Bills: Drop 10–20% (£1,200–1,350/year) by 2040 via efficiency, nuclear scale, and subsidy cuts—£50–100 below 2023’s £1,500.
- Emissions:
- Power sector: ~20 MtCO2/year (gas + lifecycle renewables/nuclear) vs. 50 Mt now, down 60%.
- Total UK: 200–250 MtCO2e/year by 2040 (from 405 Mt), a 40–50% cut, assuming transport/heating shift.
- Global: Adds 20–30 MtCO2/year vs. zero-emission ideal (0.05–0.08% of 36,800 Mt), negligible vs. 0.32% fossil plan.
Why It Works- Nuclear Backbone: Cheap, reliable, zero-emission baseload trumps CCS gas (£100–150/MWh) or coal (£80–100/MWh).
- Renewable Retention: Uses sunk costs, avoids overbuild (£70B+), and pairs with batteries for peaks.
- Gas Bridge: Keeps costs low (£50–70/MWh) and grid stable while nuclear scales, phasing out naturally.
- Efficiency: Cuts demand, amplifying savings and emission reductions without pricy tech.
This avoids carbon capture’s high costs (£15–30B for 20 GW gas), slashes emissions 40–50%, and trims bills 10–20% long-term. It’s a slow burn—20–30 years—but delivers a leaner, greener grid without breaking the bank.

Question
If Britain carries on with its drive for net zero by replacing transport with electric cars / trucks and forcing all energy to be driven by electricity then what would the outcome be without using any carbon based energy.
Answer
If Britain pursues its net zero drive by fully replacing transport (cars, trucks, etc.) with electric vehicles (EVs) and shifting all energy to electricity—while eliminating all carbon-based energy (gas, coal, oil)—the outcome hinges on replacing the entire energy system with zero-carbon electricity sources. This assumes no fossil fuels remain in the mix, no carbon capture, and all demand (power, heat, transport) is electrified. Let’s break down the implications, costs, and feasibility as of February 26, 2025, focusing on a long-term endpoint (e.g., 2050).
- Step 1: Energy Demand Assessment
- Current Electricity Demand: ~300–320 TWh/year (35 GW average, 50 GW peak).
- Transport: Cars, trucks, and buses use ~300 TWh/year (petrol/diesel equivalent). Electrifying with EVs (3–4 kWh/mile for cars, 1–2 kWh/mile for trucks) yields ~100–120 TWh/year due to higher efficiency (EVs convert 80% of energy to motion vs. 20–30% for combustion).
- Heating: Gas boilers (~300 TWh/year) and industrial heat (~100 TWh) total ~400 TWh. Heat pumps (COP 3–4) cut this to ~120–150 TWh/year electrically.
- Total New Demand: 300 (current) + 110 (transport) + 135 (heating) = ~545–555 TWh/year, roughly doubling current electricity needs to **550 TWh/year** (63 GW average, ~90–100 GW peak with seasonal spikes). - Step 2: Replacing Carbon-Based Energy
Without fossil fuels (currently ~150–200 TWh/year from gas/coal), all 550 TWh must come from zero-carbon sources: nuclear, wind, solar, hydro, biomass. Current mix:
- Nuclear: 50 TWh (7 GW).
- Wind/Solar: 94 TWh (44.4 GW).
- Hydro/Biomass: ~15–20 TWh (3–4 GW).
- **Shortfall**: 550 – (50 + 94 + 17.5) = ~388 TWh/year to replace. - Step 3: Zero-Carbon Energy Options
- Nuclear:
- 1 GW at 90% capacity factor = 7.9 TWh/year.
- To cover 550 TWh: 550 ÷ 7.9 = ~70 GW (70 plants at 1 GW each).
- Current: 7 GW. New needed: 63 GW.
- Cost: SMRs at £2–3B/GW = £126–189B; large reactors (Hinkley C) at £7B/GW = £441B. Split the difference at £200B for 63 GW.
- Wind:
- Offshore (40% capacity factor): 1 GW = 3.5 TWh/year. 388 TWh ÷ 3.5 = 111 GW.
- Solar (11%): 1 GW = 0.96 TWh/year. 388 TWh ÷ 0.96 = 404 GW.
- Current: 44.4 GW. New: ~100 GW wind + 50 GW solar (balancing land use) = 150 GW total.
- Cost: £1.5M/MW offshore wind = £150B for 100 GW; £500k/MW solar = £25B for 50 GW. Total: £175B.
- Mixed Approach: 40 GW nuclear (316 TWh) + 70 GW wind (245 TWh) + 10 GW solar (9.6 TWh) = ~570 TWh, covering demand with buffer.
- Cost: £80B (nuclear) + £105B (wind) + £5B (solar) = £190B. - Step 4: Infrastructure and Storage
- Grid Upgrades: Doubling demand needs £20–30B for transmission/distribution (National Grid estimates £15–20B/decade for net zero).
- Storage: Wind/solar intermittency requires backup. 100 GW offline (calm, dark days) needs ~10–20 GWh/day storage. Batteries at £100/kWh = £100–200B for 1–2 days (100–200 GWh). Pumped hydro or hydrogen adds £10–20B.
- EV Charging: 30 million EVs need 500,000 chargers (£10–15B).
- Heat Pumps: 25 million homes at £5k each (subsidized) = £125B.
- Total Infra Cost: £165–265B (midpoint £215B).
Outcome Energy Supply - Capacity: 40 GW nuclear + 80 GW wind/solar = 120 GW installed, delivering 570 TWh/year with storage smoothing gaps.
- Reliability: Nuclear baseload (40 GW) covers average demand (63 GW); wind/solar + storage handle peaks (90–100 GW). Rare shortfalls met by imports (6 GW) or demand management.
- Emissions: Near-zero from energy (lifecycle: 10–20 gCO2/kWh vs. 400–900 gCO2/kWh fossil), cutting UK total from 405 MtCO2e to ~50–100 MtCO2e (industry, agriculture residuals).
Costs - Build Cost: £190B (generation) + £215B (infra) = **£405B** over 25 years (£16B/year), vs. £70B for 2010–2023 renewables in 13 years.
- Operating Cost: Nuclear £60–80/MWh, wind £40–50/MWh, solar £30–40/MWh. Average ~£50–60/MWh (vs. £50–70/MWh gas, £100–200/MWh 2022 peaks).
- Bills: £1,200–1,400/year/household (550 TWh ÷ 27M homes = 20,370 kWh × £0.06–0.07/kWh), 10–20% below 2023’s £1,500, assuming efficiency gains (EVs, heat pumps save £500–800/year/household on fuel/heat).
- Economy: £405B investment (1–2% GDP/year) boosts jobs (nuclear, wind manufacturing), but taxes or debt rise £500–600/household/year to fund.
Challenges - Land: 70 GW wind (140,000 turbines at 500 kW each) and 10 GW solar (40,000 acres) strain rural/coastal space, risking public pushback.
- Build Time: 40 GW nuclear takes 20–30 years (2 GW/year max historically); wind/solar faster (5–10 GW/year) but weather-dependent.
- Supply Chains: Uranium, rare earths (wind), lithium (batteries) rely on imports, vulnerable to global shocks.
- Shortfalls: Calm, dark winters (5–10% of year) could cut wind/solar to 10–20 GW, needing 40–50 GW backup—storage or overbuild adds £50–100B.
Final Outcome - Britain achieves net zero energy (0 MtCO2 from power/transport/heat), with emissions at 50–100 MtCO2e/year from non-energy sectors—a 75–90% cut from 405 Mt. Energy costs drop 10–20% long-term (£1,200–1,400/year) via efficiency and stable £50–60/MWh generation, but requires £405B (£16B/year) investment—affordable if phased over 25 years (less than NHS budget, £180B/year). Supply is reliable with nuclear baseload and storage, though land use and build timelines pose risks. Without fossil fuels, it’s a tightrope—technically feasible, economically viable, but politically and logistically brutal. Success hinges on execution and public buy-in.
Question
What are the current dangers of the UK energy policy taking into account build times for any new projects
Answer
The UK’s current energy policy, as of February 26, 2025, is heavily geared toward achieving net zero by 2050, with a strong push to decarbonize electricity by 2035. This involves phasing out coal (completed 2024), reducing gas reliance, scaling up renewables (wind, solar), expanding nuclear, and electrifying transport and heating. However, when factoring in build times for new projects, several dangers emerge that threaten energy security, cost stability, and reliability. Here’s an analysis of the key risks:
- 1. Over-Reliance on Intermittent Renewables - Policy: The UK aims for 50 GW of offshore wind by 2030 (up from ~14 GW) and significant solar growth (targeting 70 GW total renewables by 2035). This builds on the existing 44.4 GW (30 GW wind, 14.4 GW solar) producing 94 TWh/year.
- Build Times: Offshore wind farms take 5–7 years (e.g., Hornsea One: 2016–2020 for 1.2 GW), solar 1–3 years per GW. Adding 35–40 GW by 2035 needs 3–4 GW/year—achievable but tight, with delays common (supply chains, permits).
- Danger: Wind/solar are weather-dependent (40% and 11% capacity factors). A 50 GW wind fleet delivers ~175 TWh/year, solar 20–30 TWh, but calm, dark periods (e.g., winter highs of 50 GW demand) could see output drop to 5–10 GW. Current gas (40 GW) covers gaps, but its planned phase-down (to ~20 GW by 2035) risks blackouts if renewables lag. No new gas is planned, and storage (batteries at 4 GW, 8 GWh) scales too slowly (1–2 GW/year, 5–10 years to 20 GW). - 2. Slow Nuclear Deployment - Policy: Nuclear targets 24 GW by 2050 (from 7 GW), with Hinkley Point C (3.2 GW by 2027) and Sizewell C (3.2 GW by 2030s) in progress. Small modular reactors (SMRs) are eyed for 2035+.
- Build Times: Large reactors take 10–15 years (Hinkley C: 2018–2027, delayed from 2025; £25B). SMRs, unproven at scale, need 7–10 years for first units (Rolls-Royce aims 2030s, £2–3B/GW). Adding 17 GW by 2050 requires 1 GW/year from 2030—historically, the UK maxed at 2 GW/year (1990s).
- Danger: Aging plants retire (5 GW gone by 2030), dropping to 2 GW before Hinkley/Sizewell add 6.4 GW. A 5–10-year gap (2030–2035) with ~5 GW nuclear risks 40 TWh/year shortfall (10% of demand). Gas or imports must fill this, but gas cuts clash with policy, and interconnectors (6 GW) are weather-tied to Europe’s grid. - 3. Electrification Outpacing Supply - Policy: Ban petrol/diesel cars by 2035, push EVs (30 million by 2050), and replace gas boilers with heat pumps (600,000/year by 2028, 25 million by 2050). Electricity demand could hit 550 TWh (63 GW avg., 100 GW peak) vs. 300 TWh now.
- Build Times: EV charging (500,000 stations, £10–15B) and heat pump rollout (£125B) need 10–20 years. Grid upgrades (£20–30B) take 5–10 years per phase—National Grid lags on 2035 targets.
- Danger: Demand rises 50% by 2040 (450 TWh) before supply catches up. Current capacity (80 GW total, ~50 GW firm) can’t handle 100 GW peaks without 20–30 GW new firm power by 2035. Slow nuclear/renewable builds mean 100–150 TWh/year gaps (25–35 GW), risking £200–300/MWh price spikes (2022 levels) or rolling blackouts (2–5% of hours). - 4. Gas Phase-Out Without Backup - Policy: Coal’s gone (2024), gas to shrink from 40 GW (120 TWh/year) to a “strategic reserve” by 2035 (~20 GW). No new gas plants are funded, despite North Sea potential.
- Build Times: CCGT plants take 3–5 years (£750M/GW). Adding 20 GW by 2035 is feasible but uncommitted—policy bets on renewables/storage instead.
- Danger: Gas covers 40–50% of supply now (50 GW peak). Cutting to 20 GW drops firm capacity to ~30 GW (nuclear 10 GW, biomass/hydro 5 GW) vs. 63 GW average demand by 2040. A 33 GW shortfall (290 TWh/year) emerges if renewables/storage falter—e.g., a 5-day wind lull (10% output) needs 40 GW backup, but only 20 GW gas remains. Costs soar (£1B/day imports) or lights dim. - 5. Cost Escalation and Funding Gaps - Policy: £50–70B/decade for net zero (wind, nuclear, grid), funded via taxes (£500–700/household/year) and bills (£200–300/year CfD levies).
- Build Times: £190B generation + £215B infra (£405B total) over 25 years (£16B/year) exceeds current pace (£5–10B/year). Delays (e.g., Hinkley’s £5B overrun) compound this.
- Danger: Slow builds delay cost savings (£50–60/MWh nuclear/wind vs. £70–100/MWh gas). Households face £1,700–2,000/year bills (2022 crisis levels) through 2030s if gas/import reliance persists. Public backlash (20–30% bill hikes) could derail policy—e.g., heat pump resistance (10% uptake vs. 600k target). - 6. Supply Chain and Land Risks - Policy: 50 GW wind, 24 GW nuclear, 20 GW solar need rare earths, uranium, and space (140,000 turbines, 80,000 acres solar).
- Build Times: Global shortages (lithium, copper) delay projects 1–3 years (e.g., 2023 wind turbine bottlenecks). Planning disputes (onshore wind, nuclear sites) add 2–5 years.
- Danger: Imports falter (China controls 70% rare earths), stalling 5–10 GW/year builds. Rural opposition caps onshore wind/solar at 10–20 GW below targets, forcing offshore (£1.5M/MW) over cheaper onshore (£1M/MW), adding £10–20B.
Outcome Scenarios- Best Case: Wind hits 50 GW by 2030, nuclear 10 GW by 2035, storage 10 GW. Demand rises to 450 TWh by 2040, met with 80 GW capacity (50 GW firm). Bills drop to £1,400/year, emissions fall 50% (200 MtCO2e). Requires flawless execution.
- Likely Case: Wind at 40 GW, nuclear 7 GW, storage 5 GW by 2035. 50 GW shortfall vs. 90 GW peak demand. Gas lingers (30 GW, 50 MtCO2/year), bills hit £1,800/year, blackouts 1–2% of hours. Emissions at 250 MtCO2e (40% cut).
- Worst Case: Wind stalls at 30 GW, nuclear at 5 GW by 2035 (delays). 60 GW gap, 20 GW gas + imports fail (EU shortages). £2,000–2,500/year bills, 5–10% blackout risk, emissions 300 MtCO2e (25% cut).
Core Dangers1. Energy Security: 20–40 GW firm capacity gaps by 2035 (5–10 years) as gas fades before nuclear/renewables scale, risking blackouts or import dependence (£5–10B/year).
2. Cost Spikes: £200–300/MWh wholesale prices through 2030s if supply lags demand, pushing bills 20–50% above 2023’s £1,500.
3. Build Delays: 10–15-year nuclear timelines and 5–7-year wind projects miss 2035 targets by 30–50%, leaving 100–150 TWh/year uncovered.
4. Policy Fragility: Public revolt (30–40% cost hikes) or global shocks (10–20% material shortages) could halt net zero, forcing fossil fuel backtracking.
The UK’s policy banks on rapid decarbonization, but build times expose a decade-long vulnerability (2030–2040). Without interim gas or faster execution, it’s a gamble—cheap, clean energy by 2050, but shortages and high costs loom first.
Question
Does the united kingdom have the current energy capacity to rapidly increase its industrial base (production of arms / boats / planes etc to combat the threat of russia using the current energy policy
Answer
To assess whether the United Kingdom has the current energy capacity to rapidly increase its industrial base—specifically for producing arms, boats, planes, and other defense-related manufacturing to counter a potential threat from Russia—while adhering to its current energy policy (net zero trajectory, renewables focus, fossil fuel phase-down), we need to evaluate existing energy supply, industrial demand growth, and policy constraints as of February 26, 2025. The answer hinges on available capacity, reliability, and build times for new projects.
Current Energy Capacity - Total Installed Capacity: ~80 GW (2023 data, slightly grown by 2025):
- Gas: 40 GW (120–140 TWh/year, 80% capacity factor).
- Nuclear: 7 GW (50 TWh/year, 90% capacity factor).
- Wind: 30 GW (80–100 TWh/year, 30–40% capacity factor).
- Solar: 14.4 GW (12–14 TWh/year, 10–11% capacity factor).
- Biomass/Hydro: 4–5 GW (15–20 TWh/year).
- Annual Generation: ~300–320 TWh/year (35 GW average output).
- Peak Demand: 45–50 GW (winter evenings), average demand ~35 GW.
- Firm Capacity: ~50–55 GW (gas, nuclear, biomass), with wind/solar adding ~10–15 GW on average but dropping to 5–10 GW in calm, dark conditions.
- Spare Capacity: 5–15 GW on average, shrinking to near-zero at peaks without imports (6 GW via interconnectors).
Industrial Demand Increase **Baseline Industrial Use**: Industry consumes ~90 TWh/year (~10 GW average), mostly electricity and gas for manufacturing (steel, chemicals, etc.).
- Defense Expansion: Rapidly scaling arms (e.g., missiles, tanks), boats (frigates, submarines), and planes (Tempest fighters) requires:
- Steel/Aluminum: 1–2 TWh/year per million tons (e.g., 500,000 tons extra for ships/planes = 0.5–1 TWh).
- Assembly: High-energy processes (welding, machining) add 1–2 kWh/unit for small arms, 10–20 MWh per vehicle/plane. Assume 1,000 planes (20 GWh), 10 ships (100 GWh), 100,000 arms (200 GWh) = ~0.3–0.5 TWh/year.
- Workforce/Facilities: New factories, 24/7 operation, add 0.5–1 GW constant load (~4–9 TWh/year).
- Total Extra Demand: 5–15 TWh/year (0.6–1.7 GW average), doubling to 10–30 TWh (1.2–3.4 GW) for a major ramp-up (e.g., WWII-scale effort, 5–10% GDP).
- Peak Impact: Industrial load is steady, so add 1–3 GW to 50 GW peak demand (51–53 GW).
Current Policy Constraints Renewables Focus: Targets 50 GW offshore wind by 2030, 70 GW renewables by 2035, but build times (5–7 years wind, 1–3 years solar) mean only 5–10 GW added by 2028–2030.
- Fossil Fuel Phase-Out: Coal gone (2024), gas to shrink to 20 GW by 2035. No new gas plants funded, despite 3–5-year builds.
- Nuclear Lag: 7 GW now, Hinkley C (3.2 GW) by 2027, Sizewell C (3.2 GW) by 2030s—10–15-year timelines limit growth to 10–13 GW by 2035.
- Storage: 4 GW batteries (8 GWh) scale too slowly (1–2 GW/year) for rapid industrial spikes.
Capacity Assessment Short-Term (2025–2028):
- Supply: 80 GW installed, 50–55 GW firm, 300–320 TWh/year.
- Demand with Industry: 35 GW avg. + 1–3 GW = 36–38 GW; peak 50 GW + 1–3 GW = 51–53 GW.
- Fit: Spare 5–15 GW covers average, but peaks exceed firm capacity (50–55 GW) by 0–3 GW in calm/dark conditions. Imports (6 GW) or gas at 80% (32 GW) bridge this, but no buffer for weather extremes or EU supply cuts (Russia risk).
- Mid-Term (2028–2035):
- Supply: Wind to 40 GW, nuclear to 10 GW, gas at 30 GW = ~85–90 GW installed, 55–60 GW firm, 350–400 TWh/year.
- Demand: 40 GW avg. (electrification) + 1–3 GW = 41–43 GW; peak 55–60 GW.
- Fit: 5–15 GW spare avg., but peaks strain firm capacity. Gas cuts to 20 GW by 2035 drop firm to 35–40 GW vs. 60 GW need—20–25 GW shortfall without new builds.
Dangers and Gaps 1. Immediate Shortfall: A 1–3 GW industrial spike now risks 5–10% blackout hours in winter (calm winds, dark). Gas can’t scale beyond 40 GW without new plants (3–5 years, £750M/GW), and renewables lag (5–10 GW by 2028).
2. Reliability: 44.4 GW wind/solar drops to 5–10 GW in bad weather, leaving 40 GW gas + 7 GW nuclear (47 GW) vs. 51–53 GW demand. No coal, thin storage (8 GWh = 10–20 minutes at scale) means rolling cuts if imports fail.
3. Russia Threat: Russia’s 2022 gas cuts to Europe showed interconnector vulnerability (6 GW, 10% peak supply). A Baltic blockade or cyberattack on wind farms (20% offshore risk) could slash 5–10 GW, crippling output.
4. Build Time Lag: Adding 10 GW gas (3–5 years, £7.5B) or 10 GW wind (5–7 years, £15B) takes too long for “rapid” expansion (1–3 years). Nuclear (10–15 years) is irrelevant short-term.
5. Cost: £100–200/MWh spikes (2022 levels) if gas/import reliance grows, raising industrial costs 20–50% (£1–2B/year) and bills to £1,800–2,000/year.
Can It Be Done? - No, Not Rapidly: Current capacity (80 GW, 50–55 GW firm) barely meets 35 GW average and 50 GW peak without industry growth. A 1–3 GW industrial surge pushes demand beyond firm supply in 5–10% of hours, risking blackouts or £5–10B/year imports. Policy’s renewable/nuclear focus adds 5–10 GW by 2028, too slow for a 2025–2027 ramp-up.
- Workaround: Max out gas (40 GW flat-out, 140 TWh/year) and delay net zero (20 GW new gas, £15B, 3–5 years). Covers 3–5 GW extra by 2028, but emissions rise (50–70 MtCO2/year) and costs jump (£70–100/MWh vs. £50–60/MWh renewables).
- Russia Factor: Without fossil fuel flexibility, a 5–10 GW supply hit (imports, wind sabotage) leaves no cushion—industry halts or defense output drops 20–30%.
Conclusion The UK lacks the current energy capacity to rapidly boost its industrial base for defense under its net zero policy. A 1–3 GW demand hike strains an already tight grid (5–15 GW spare), and build times (3–15 years) can’t deliver fast enough. Gas could bridge this, but policy resists, risking security (blackouts, Russia threats) and costs (£1–2B/year extra). Relaxing net zero for 5–10 years (more gas) is the only short-term fix—otherwise, production lags, and vulnerability grows.
Outcome of the converstaion
As demonstrated, Keir Starmer’s plans for industrial and defense expansion are unfeasible under the UK’s current energy policy. Without a strategic rethink, the short- and medium-term goals for energy security and defense capability will remain out of reach. This failure risks weakening the UK’s global standing, increasing costs for citizens, and losing jobs to nations with the capacity to meet these demands.
There is still time to avert this outcome, but inaction now will exact a steep long-term price for both past and present mistakes.

Trending AI News Articles


AI Questions and Answers section for UK Energy Security and Industrial Expansion
Welcome to a new feature where you can interact with our AI called Jeannie. You can ask her anything relating to this article. If this feature is available, you should see a small genie lamp above this text. Click on the lamp to start a chat or view the following questions that Jeannie has answered relating to UK Energy Security and Industrial Expansion.
Be the first to ask our Jeannie AI a question about this article
Look for the gold latern at the bottom right of your screen and click on it to enable Jeannie AI Chat.